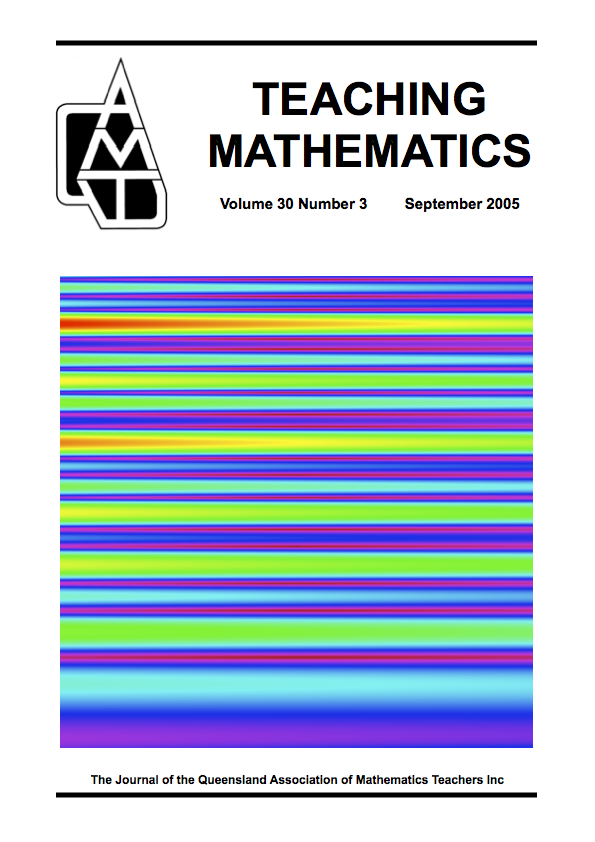
This front cover shows a density map of the Riemann zeta function, ζ(s), in the complex plane. The region shown here goes from 0.3 + i (bottom left corner) to 0.7 + 70i (top right corner), so that the vertical centre of the picture corresponds to the line where the real part of the number is 1/2. You can possibly see the small darker regions in this picture; when the function is zero the picture is completely black. The famous Riemann hypothesis states that all the zeros of this function lie along the critical line where the real part is 1/2. That certainly seems true from this picture, but of course that is far from a proof!