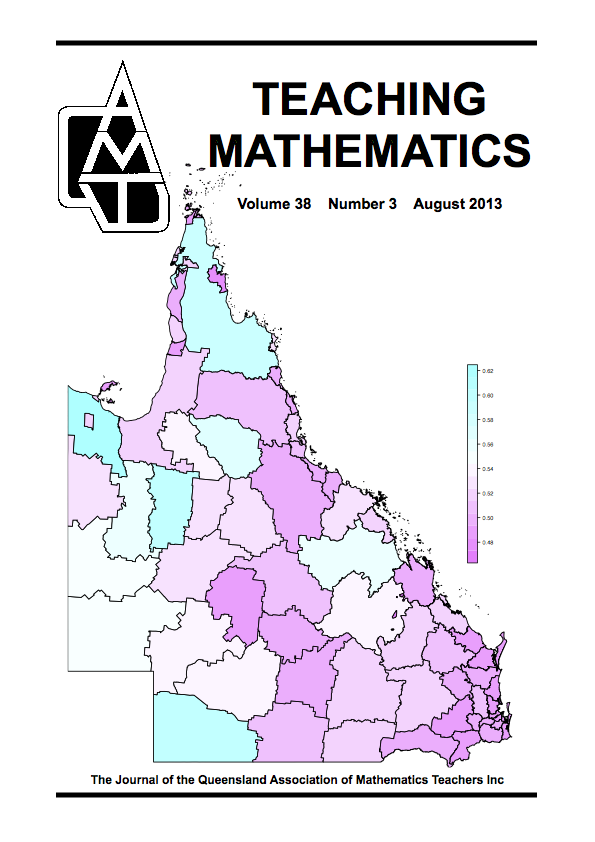
The map of Queensland on the cover is coloured by the proportion of males in each of the 74 local government areas, ranging from 47% in Woorabinda to 61% in Burke. The plot is based on 2011 census data from the Australian Bureau Statistics and was plotted using the freely available R software for statistical computing.