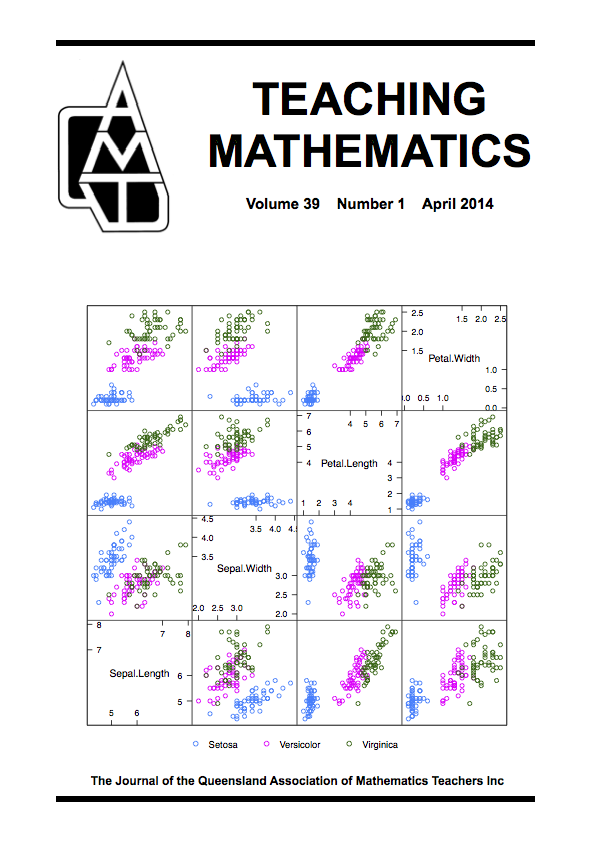
Edgar Anderson’s data on the morphologic variation of Iris flowers has become a classic example in statistics and machine learning. The key question is whether you can determine which species you are looking at based on the four measurements from the petals and sepals. Here a scatter plot matrix is used to show pairs of variables plotted against each other. Can you find a rule? More background and other details are at http://en.wikipedia.org/wiki/Iris_flower_data_set