Welcome to my research page.
Welcome to my research page. I am a cosmologist, and spend most of my time trying to figure out why the expansion of the universe is accelerating. In other words, searching for dark energy. Sometimes that leads down surprising paths, as some of the summaries below will show. Follow the links for some more detailed descriptions of the more exciting and weird aspects of the universe.
For a detailed but non-mathematical overview of modern cosmology, explaining the observational evidence for dark energy and dark matter, check out this review I wrote in 2014.
Weighing Supermassive Black Holes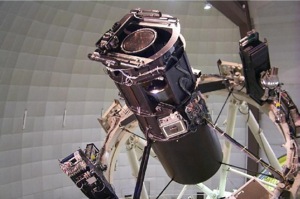
OzDES: The Australian Dark Energy Survey (2013-2020)
Active Galactic Nuclei (AGN) are the most luminous, persistent sources in the universe. They're fuelled by supermassive black holes consuming gas at the centres of galaxies. While the gas is falling in it gets crazy hot (technical term) and shines brightly, ionising a bubble around it and illuminating the clouds of dust and gas on the outskirts. The brightness varies as clumps of matter fall in. We're watching the brightness vary using images from the Blanco telescope in Chile and then detecting the "reflection" of that light from the surrounding clouds using spectra from the Anglo-Australian Telescope. By measuring the time delay between the two we can "weigh" the black hole, because more massive black holes make hotter gas, which ionises a bigger bubble, so the light has to travel for longer before being reflected from the emission line clouds.
Using this "reverberation mapping" technique we're monitoring about 800 Active Galaxies over five years, from which we expect to measure time delays for an impressive 30-40% of our sample, resulting in about 250 new measurements of supermassive black holes. Even more exciting, is that our observations reach galaxies so distant that the emitted the light we're seeing 12 billion years ago (i.e. a redshift of about 4). The current state of the art sample contains 41 AGN out to only ~3.5 billion years ago (z~0.3). So for the first time we'll have direct measurements demonstrating how supermassive black holes have grown over the last 12 billion years.
DES homepage: https://www.darkenergysurvey.org/
OzDES homepage: http://www.mso.anu.edu.au/ozdes/
Simulations of the OzDES AGN reverberation mapping project: King et al. 2015
A new type of standard candle
Once we can measure the time delay we can infer the intrinsic luminosity of the centres of these glowing active galaxies. (The brighter they are, the longer the time delay.) Hey presto, we have a standard candle! In 2011 we published a paper showing the first Hubble diagram (brightness vs redshift) of AGN. These AGN are big, messy objects, but the physics of light and ionisation is quite simple, so there's good reason to expect that they'll be good standard candles -- however, its something we're going to test in much more detail with OzDES.
This discovery was awarded 4th in Physics World's Top 10 breakthroughs of 2011"!
A New Cosmological Distance Measure Using Active Galactic Nuclei, Watson, Denney, Vestergaard, Davis 2011
High-redshift standard candles: predicted cosmological constraints, King, Davis, et al. 2014
Supernova Cosmology
Discovering Dark Energy... and trying to figure out what it is!
Supernovae are exploding stars. In the early 1990s it was discovered that type Ia supernovae make great standard candles. That means that we know how intrinsically bright they are. In astronomy that is incredibly useful, because just by measuring how bright they appear you can measure how far they are away. Combined with a measurement of the redshift, which tells us how fast they are receding from us, this discovery allowed astronomers to measure the expansion rate of the universe in the distant past and compare it to the expansion rate now. Much to our surprise the expansion appears to be accelerating, contrary to our usual expectation that gravity only ever pulls! In 2011 some of my colleagues won the Nobel Prize for that discovery. (Congrats Brian, Saul, and Adam!)
During my career so far I've been part of three major supernova surveys following up on the original discovery of the accelerating universe and measuring it in more detail to figure out what's causing it. (The years in brackets below show the years of my life spent on these surveys... other people worked for much longer to make these happen!)
The Australian Dark Energy Survey (OzDES: 2013-2020) on Blanco telescope in Chile")
OzDES is a 5-year survey using 100 nights on the Anglo-Australian telescope to take spectra of galaxies in the ten deep fields that are being monitored by the international Dark Energy Survey. Amongst the many varied aims of this survey is to monitor about 2,500 type Ia supernovae and get redshifts of their host galaxies, so we can test dark energy. The original Nobel-prize winning discovery of dark energy was made using just 52 supernovae between the two groups. With a couple of thousand supernovae we can not only make the best-ever measurement of the expansion, but we can also do completely new types of tests, such as looking for the effect of gravitational lensing on the magnification of the supernovae.
DES homepage: https://www.darkenergysurvey.org/
OzDES homepage: http://www.mso.anu.edu.au/ozdes/
Our survey overview paper:
OzDES multifibre spectroscopy for the Dark Energy Survey: first-year operation and results: Yuan et al. 2015
Sloan Digital Sky Survey (SDSS: 2007-2009)
") The SDSS Supernova Survey has discovered hundreds of supernovae in the region between redshifts 0.1 and 0.3, known as the "redshift desert". Ironically this intermediate redshift range was more difficult to get to than the more distant supernovae because you need a telescope with an enormous field of view in order to be able to cover a large enough region of sky. In late 2009 we published a series of three papers covering the results from the first year of data. Adding 103 supernovae to the global sample revealed some interesting issues, perhaps most importantly that we need to better understand the supernovae and their light curves. There were some tantalising hints that some of the more exotic cosmological models may improve on our standard cosmological constant explanation of dark energy, but as data improved after these publications those hints went away.
The SDSS Supernova Survey has discovered hundreds of supernovae in the region between redshifts 0.1 and 0.3, known as the "redshift desert". Ironically this intermediate redshift range was more difficult to get to than the more distant supernovae because you need a telescope with an enormous field of view in order to be able to cover a large enough region of sky. In late 2009 we published a series of three papers covering the results from the first year of data. Adding 103 supernovae to the global sample revealed some interesting issues, perhaps most importantly that we need to better understand the supernovae and their light curves. There were some tantalising hints that some of the more exotic cosmological models may improve on our standard cosmological constant explanation of dark energy, but as data improved after these publications those hints went away.
SDSS homepage: http://sdssdp47.fnal.gov/sdsssn/sdsssn.html
First-Year Sloan Digital Sky Survey-II Supernova Results:
Hubble Diagram and Cosmological Parameters: Kessler et al. 2009
Constraints on Nonstandard Cosmological Models: Sollerman et al. 2009
Consistency and constraints with other intermediate-redshift datasets: Lampeitl et al. 2009
ESSENCE (2004-2007)
 ESSENCE was a collaboration that aimed to measure the equation of state of dark energy to better than 10%. At the time, that was an ambitious goal (its an indication of how far the field has come in just a decade that now we're trying to do better than 1%). We discovered and monitored about 200 type Ia supernovae between redshifts 0.3 and 0.8.
In 2007 we released our first cosmological results. These came out in a series of three papers in the September 2007 edition of the Astrophysical Journal. I led the third of these, which tested exotic cosmological models using model selection criteria. You can read more about my part of the project here.
As part of our Davis et al. 2007 paper, Scrutinizing Exotic Cosmological Models we released the most complete combined supernova data set to date, including Supernova Legacy Survey, ESSENCE and Higher-Z data with the nearby sample. You can download this data set and use it to do your own cosmology fits from http://www.dark-cosmology.dk/archive/SN.
ESSENCE home page: http://www.ctio.noao.edu/wproject/.
The three first results papers:
Scrutinizing Exotic Cosmological Models... : Davis et al. 2007
Observational Constraints on the Nature of Dark Energy... :: Wood-Vasey et al. 2007
Survey Optimization, Observations, and Supernova Photometry: Miknaitis et al. 2007
Spectroscopy papers:
Constraining Cosmic Evolution of Type Ia Supernovae: Foley et al. 2007
Using Line Profiles to Test the Fraternity of Type Ia Supernovae at High and Low Redshifts: Blondin et al. 2006
Light rides the roller coaster of space
Measuring dark energy using gravitational lensing.
As light travels through space it rides up and down the hills and valleys of curved space. As it falls into clusters it gains energy (gets blueshifted) and then loses energy (gets redshifted) as it climbs its way out again. It's also bent as it gets focussed when it passes dense patches and de-focussed as it passes through voids. So the light we observe is not the pristine light that was emitted, but light that has been sublty varied by the path its taken to get to us. By looking at those subtle variations in redshift and magnification we can detect the presence of the matter (including dark matter) and the effect of dark energy on the distribution of matter. This gives us yet another way to test cosmology.
The effect of our local environment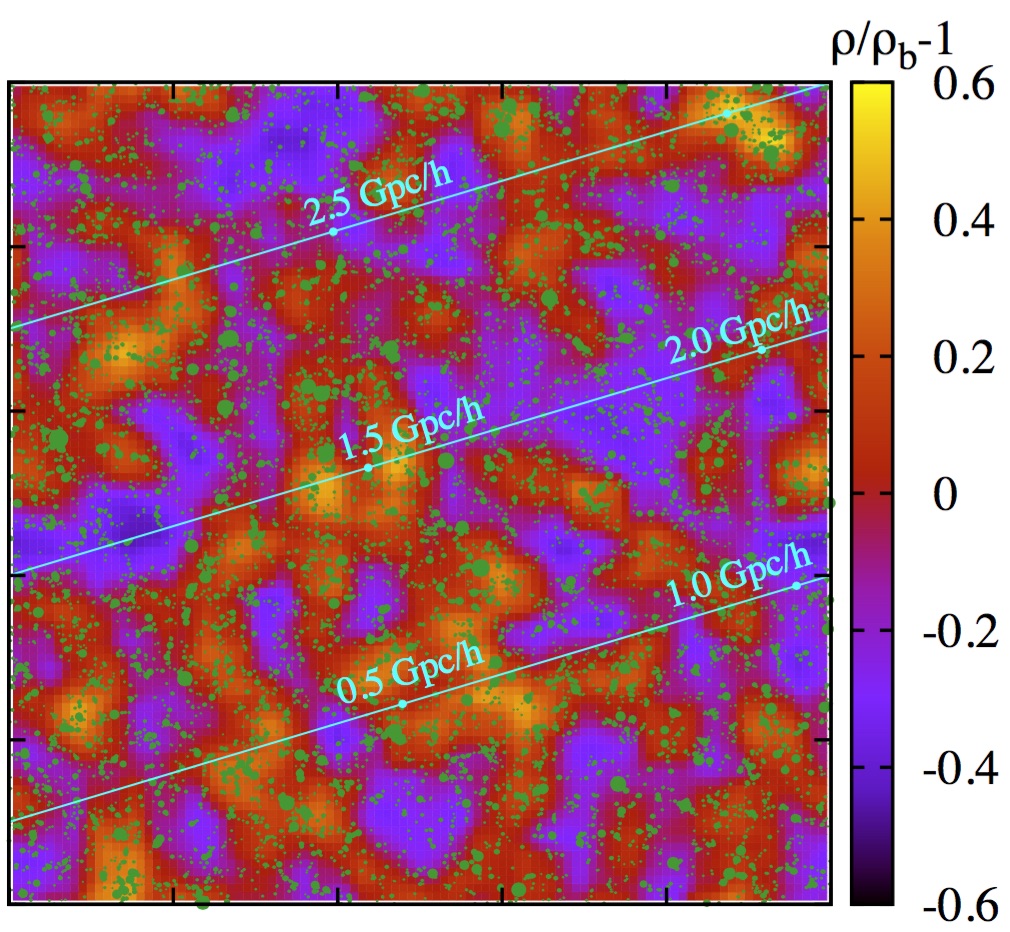
As light rides the roller-coaster of space the effect usually gets close to averaging out as it goes up and down the gravitational hills. However, the one effect that doesn't cancel out is our local environment. If we live in a valley then the light never has a chance to climb out to compensate for the energy it gained coming in. Moreover, all the light arriving at our position would be similarly affected. Even a very small (0.0001) systematic shift in redshift can cause a bias in our cosmological measurements. In these papers we pointed that out and quantified it.
Local gravitational redshifts can bias cosmological measurements: Wojtak, Davis, Wiis 2015
Residual Hubble-bubble Effects On Supernova Cosmology: Sinclair, Davis, Haugbølle 2010
Baryon Acoustic Oscillations compared to other AAT surveys")
The WiggleZ Dark Energy Survey
Who says sound waves can't propagate in space? Well, they can't any more, but way back in the very early universe matter and light were easily dense enough to sustain sound waves. The ripples left over from these enormous universe-wide vibrations have left their imprint on the pattern of galaxies we now see in the sky. These are known as Baryon Acoustic Oscillations, and now telescopes and spectrographs are getting strong enough that we can actually measure these remnant ripples.
In 2008 I moved back to Australia to work with the WiggleZ Dark Energy Survey. This is a baryon acoustic oscillation survey run on the Anglo Australian Telescope which observed over 200,000 galaxies out to a redshift of 1.0, i.e. out to half the age of the universe ago. This was the largest scale galaxy redshift survey ever undertaken at the time and with it we were able to do all sorts of cool science. Apart from the normal cosmological questions, such as what are dark energy and dark matter, we also were able to do things like measure the homogeneity of the universe and put upper limit on the mass of the neutrino. Particle physics using galaxies - why not?!Our final data release was in 2012 and you can download it from: http://smp.uq.edu.au/wigglez-data/
WiggleZ homepage: http://astronomy.swin.edu.au/wigglez/WiggleZ/site/
We published over 20 papers, so I won't list them all here. Instead, here are just a few of my favourites (some more are in the Large Scale Structure section below):
The WiggleZ Dark Energy Survey:
Final data release and cosmological results: Parkinson, Riemer-Sørensen, Blake, Poole, Davis, et al. 2012
Measuring the cosmic expansion history using the Alcock-Paczynski test and distant supernovae: Blake, Glazebrook, Davis et al. 2011
Mapping the distance-redshift relation with baryon acoustic oscillations: Blake, Kazin, Beutler, Davis, Parkinson et al. 2011
Testing the cosmological model with baryon acoustic oscillations at z= 0.6: Blake, Davis et al. 2011
Survey design and first data release: Drinkwater et al. 2009
The WiggleZ Dark Energy Survey: Blake et al. 2009, Astronomy & Geophysics
Large Scale Structure
The WiggleZ Dark Energy Survey
The distribution of galaxies in the universe is not random. The pattern contains the imprint of sound waves in the early universe as well as the trace of horizons... structures could only start growing once gravity could effect them, and since gravity only travels at the speed of light big things in the early universe didn't know yet that they should be collapsing! (Maybe that's how Wile E. Coyote managed to hover for a moment when he fell off cliffs.) Measuring the distribution of galaxies in the universe therefore gives us lots of information about what was happening in the early universe, how particles were interacting, and how fast it was expanding. That also lets us figure out what it was made of. Pretty cool stuff.
Homogeneity
The fundamental assumption behind most of cosmology, is that the universe is homogeneous, i.e. that it is basically the same everywhere (if you average over big volumes). That's already been pretty well determined by looking at the radiation left over from the big bang (the cosmic microwave background), but there had been some disputes over whether the galaxies were spread out homogeneously. With WiggleZ we had a big enough survey to unambiguously measure the transition from the clumpy local universe, to the on-average smooth universe on large scales. This was led by my student Morag Scrimgeour (see video).
The transition to large-scale cosmic homogeneity: Scrimgeour, Davis, Blake et al. 2012
Neutrinos (using galaxies to do particle physics!)
 Believe it or not, we can use measurements of the biggest structures in the universe - the clustering of galaxies - to do particle physics. The mass of the neutrino is a mystery, being one of the few things that wasn't a natural part of the standard model of particle physics. But neutrinos had an effect on how structures formed in the early universe, and therefore we can measure their mass, and even how many there are, by looking at galaxies.
Some papers:
http://adsabs.harvard.edu/abs/2014PhRvD..89j3505R
Combining Planck data with large scale structure information gives a strong neutrino mass constraint: Riemer-Sørensen, Parkinson, Davis 2014
What Is Half a Neutrino? Reviewing Cosmological Constraints on Neutrinos and Dark Radiation: Riemer-Sørensen, Parkinson, & Davis 2013
Simultaneous Constraints on the Number and Mass of Relativistic Species: Riemer-Sørensen, Parkinson, Davis, & Blake 2013
WiggleZ Dark Energy Survey: Cosmological neutrino mass constraint from blue high-redshift galaxies: Riemer-Sørensen, Blake, Parkinson, Davis, et al. 2012
Peculiar velocities
 All motion that's not the expansion of space
Peculiar velocities refer to all the velocities that aren't perfectly conforming to the smooth expansion of space. On average the universe is expanding, but when you look in detail at any patch of it you'll see galaxies being pulled by each other, infalling or orbiting, or generally doing interesting stuff. Watching that motion tells us how strong gravity is on intermediate scales. We know gravity is attractive here on earth. We know that something appears to make gravity repulsive on the scale of the observable universe (causing it to accelerate). What happens in that Goldilocks zone in between can tell us something about where the transition happens and what's causing the acceleration. Importantly, peculiar velocities can distinguish between models that predict the same expansion history, but differ on the details of structure formation.
You measure peculiar velocities by measuring their distance (for example using supernovae as standard candles) and comparing it to the distance you'd predict due to the redshift. The offset can be (partly) explained by the peculiar velocity. Although supernovae are obvious ways to measure distance, they're too rare to be super useful for peculiar velocities, where you want to average the motion of thousands of galaxies. Therefore we measure distances using the fundamental plane for elliptical galaxies and the Tully Fisher method for spiral galaxies.
Some papers:
The 6dF Galaxy Survey: bulk flows on 50-70 Mpc/h scales: Scrimgeour, Davis, Blake, et al. 2016
Are peculiar velocity surveys competitive as a cosmological probe?: Koda, Blake, Davis et al. 2014
The 6dF Galaxy Survey: cosmological constraints from the velocity power spectrum: Johnson et al. 2014
Deriving accurate peculiar velocities (even at high redshift): Davis & Scrimgeour 2014
The Effect of Peculiar Velocities on Supernova Cosmology: Davis, Hui et al. 2011
Supernova Bonus Research
Everything else supernova
Time dilation in the distant universe (slow motion supernovae!)
 Due to the expansion of the universe we should get time dilation of distant objects. That means distant supernovae should appear to take longer to brighten and fade than nearby ones, even if they're intrinsically identical. We wrote a paper using the spectra of supernovae as clocks, that showed that yes, the time dilation happens exactly as expected! Although we weren't seriously expecting to find anything different, the reason this is cool is that it confirms the expanation that the redshifts of distant galaxies are really due to the expansion of the universe and puts the final nail in the coffin of ideas such as "tired light" (not that it really needed any more nails!).
Time Dilation in Type Ia Supernova Spectra at High Redshift: Blondin, Davis, et al. 2008
The journal Nature was kind enough to write this up amongst their monthly research highlights (p806) for August 2008.
Making supernovae better standard candles
 Supernovae are some of the best standard candles we have, but they're not perfect. Their peak brightness actually varies by about an order of magnitude, but in a calibratable way. The ones that are brighter glow for longer. So by measuring how long a supernova takes to brighten and fade we can calculate how bright it actually was, reducing the uncertainty to about 10%.
As our measurements get more accurate and the models we're testing get more demanding this 10% accuracy is no longer enough. Our aim, therefore, is to find a better way to calibrate the supernovae. Something that lets us know the intrinsic brightness down to 1%. We're using a form of principal component analysis (PCA) to try to find patterns in the spectra that can be used to improve the calibration. PCA is a technique that is used in things like image compression to extract a simple description from complicated information. We've published some proof-of-concept papers, and are now working on doing a much better job with bigger data sets.
Papers:
Type Ia supernova diversity: Standardizing the candles: Davis, James, Schmidt & Kim 2007, AIP Conf. Proc. 924, 330.
Spectral diversity of Type Ia supernovae: James, Davis, Schmidt & Kim 2006, MNRAS 370, 933.
Expanding confusion
Clarifying common misconceptions about the expansion of the universe and cosmic horizons
 Who has not looked up at the stars and marvelled at how the universe works? In the world of physics, so often strewn with abstract equations, much effort goes into relating those abstract equations to the world we see. This quest is impeded by two major stumbling blocks. One is simply the imprecision of language. Words are rarely as precise as the equations they're explaining, so sometimes debate arises over apparent contradictions in the literature which are actually no more than sloppy wording. The more significant stumbling block is the difficulty in explaining the unintuitive concepts of quantum physics and relativity in terms of everyday analogues. Some concepts in modern physics simply don't have a direct correspondence to our everyday experience. Thus the imprecision of language compounds the impossibility of describing things we don't naturally have words for.
Yet to truly understand physics it is crucial to relate our mathematical solutions to the observable world. I've spent some time working with this problem, and trying to explain the expansion of the universe is a way that is clear and accurate. It is my hope that by explaining some of the bizarre features of the universe clearly some of the strange features of general relativity might also become more intuitive.
Can space expand faster than the speed of light?
 For the first part of my PhD thesis I explored the meaning of the expansion of the universe and attempted to debunk common misconceptions. Read this and learn how galaxies can recede faster than the speed of light without violating special relativity, how event horizons form in an accelerating universe so our observable universe resembles and inverted black hole, how light travelling in our direction can be dragged away from us by the expansion of space, and how many of the galaxies we observe in pictures such as the Hubble Deep Field are already beyond our event horizon so that we can never communicate with them.
 Left: An annotated series of spacetime diagrams depicting our universe (a.k.a. my summary of the expanding universe in a single page).
Reading:
Fundamental Aspects of the Expansion of the Universe and Cosmic Horizons: UNSW PhD Thesis 2004. (This actually won the prize for UNSW's best science PhD of 2004.)
Expanding Confusion: Common Misconceptions of Cosmological Horizons and the Superluminal Expansion of the Universe: Davis & Lineweaver 2004 (note the astro-ph version corrects a mistake in the published version!)
Solutions to the tethered galaxy problem in an expanding universe and the observation of receding blueshifted objects: Davis, Lineweaver & Webb 2003
You may also be interested in these, which are some of the best papers arising from the topics I broached in my thesis:
Is space expanding in the Friedmann universe models?: Grøn & Elgarøy 2007;
Coordinate confusion in conformal cosmology : Lewis, Francis, Barnes & James 2007;
Expanding Space: the Root of all Evil?: Francis, Barnes, James & Lewis 2007;
Joining the Hubble flow: implications for expanding space: Barnes, Francis, James & Lewis 2006.
And in this, which picks up a mistake in Section 4.2 of my 2004 PASA paper (which has been corrected in the astro-ph version!):Cosmology Under Milne's Shadow: Chodorowski 2005
Scientific American Articles
 Following on from the "Expanding Confusion" papers Scientific American was kind enough to ask me to write a review article on the topic. In it we answer such questions as: What kind of explosion was the big bang? Can galaxies recede faster than light? What is the cosmological redshift? How large is the observable universe? What expands?
Read Misconceptions about the Big Bang: Davis & Lineweaver 2005
After that first popular article was published I wrote literally hundreds of pages of responses to questions from the public. A full third of those people asked "Where does the energy go when a photon is redshifted by the expansion of the universe?" I eventually got around to writing another article answering all sorts of questions about conservation of energy in the expanding universe, that became the cover story for July 2010.
Read Is the Universe Leaking Energy?, Davis 2010.
Gamma ray bursts
The most energetic explosions in the universe
 Gamma ray bursts (GRBs) are the most energetic explosions ever seen. In a few seconds they emit more energy than our entire galaxy does in 100 years. They were initially detected in the 1960s by American satelites, launched to watch for Soviet nuclear tests, and their existence remained classified for several years. After their existence was made public in the early 1970s it took another 20 years before scientific satellites were built that were able to detect them.
Now a series of satellites have given us a much clearer picture of these enigmatic objects. The latest satellite is Swift, which detects on average two or three GRB's each week. We believe there are two types, long and short, and we believe the long ones are the result of a massive stellar explosion as a star ends its life in a supernovae. But even as we converged on this consensus a stranger-than-usual burst appeared in the sky. Our group at the Dark Cosmology Centre, as well as some other groups around the globe, followed up on a burst that should have had a supernova afterglow but didn't. This shook us from our comfort zone and showed that even if we now understand a lot more about these bursts than we did in the 1990s, there is still a lot to learn.
Our paper: No supernovae associated with two long-duration γ-ray bursts: Fynbo et al. 2007, Nature, 444, 1047
SuperNova Acceleration Probe (SNAP)
Designing a space Telescope... that never flew (2004-2006)
 When the current generation of supernova surveys are done we will still need better data if we are going to determine what is causing the universe to accelerate. SNAP was one possibility for the Joint Dark Energy Mission (JDEM) - a joint mission between the U.S. Dept. of Energy and NASA to build a probe to measure dark energy. In 2007 JDEM was named the priority mission in NASA's Beyond Einstein program, but alas funding was cut so it never flew. Now hopefully WFIRST, which is an evolution of the JDEM concept will fill the gap.
What's needed for much of cosmology is a wide-field telescope in space, able to take pictures with the resolution of the Hubble Space Telescope but covering a region more like the size of the full moon (rather than something the size of a crater). Such a telescope would be able to measure thousands of supernovae, but perhaps more excitingly, also measure Weak Lensing - a method of measuring dark energy using the gravitational warping of light by distant galaxies - and Baryon Acoustic Oscillations (see my description of BAO above). Because a wide-field telescope in space would be so versatile there is a huge amount of auxiliary science that can be done.
SNAP homepage: http://snap.lbl.gov
I worked on the supernova optimisation of SNAP, in particular the bandpasses design.
Ideal Bandpasses for Type Ia Supernova Cosmology: Davis, Schmidt & Kim, 2006
Supernova Acceleration Probe, A White Paper to the Dark Energy Task Force: Albert et al. 2005
Seeing the Nature of the Accelerating Physics: It's a SNAP, Overview White Paper to the Dark Energy Task Force: Albert et al. 2005